
Atlas Housing Download Series: Part 4 - Volatility of Rental Supply and Impacts on Rents

Rental Market Volatility
Welcome to Part 4 of the #AtlasHousingDownload – our six-part series exploring Australia’s housing market. In Part 3, we looked into the rules and regulations which govern the building sector, and how the rulebook has grown substantially over the past three decades.
In Part 4 we delve into one of clearest indicators of the health of our housing market – the rental market.
We explore how the rental market has fundamentally changed in recent years, why it has changed and what potential implications the Australian Government’s changes to negative gearing and the capital gains tax (CGT) may have on the rental market.
Same Proportions, But Bigger Overall
The split of owner occupiers-renters remains similar, but the absolute number of renters has grown significantly.
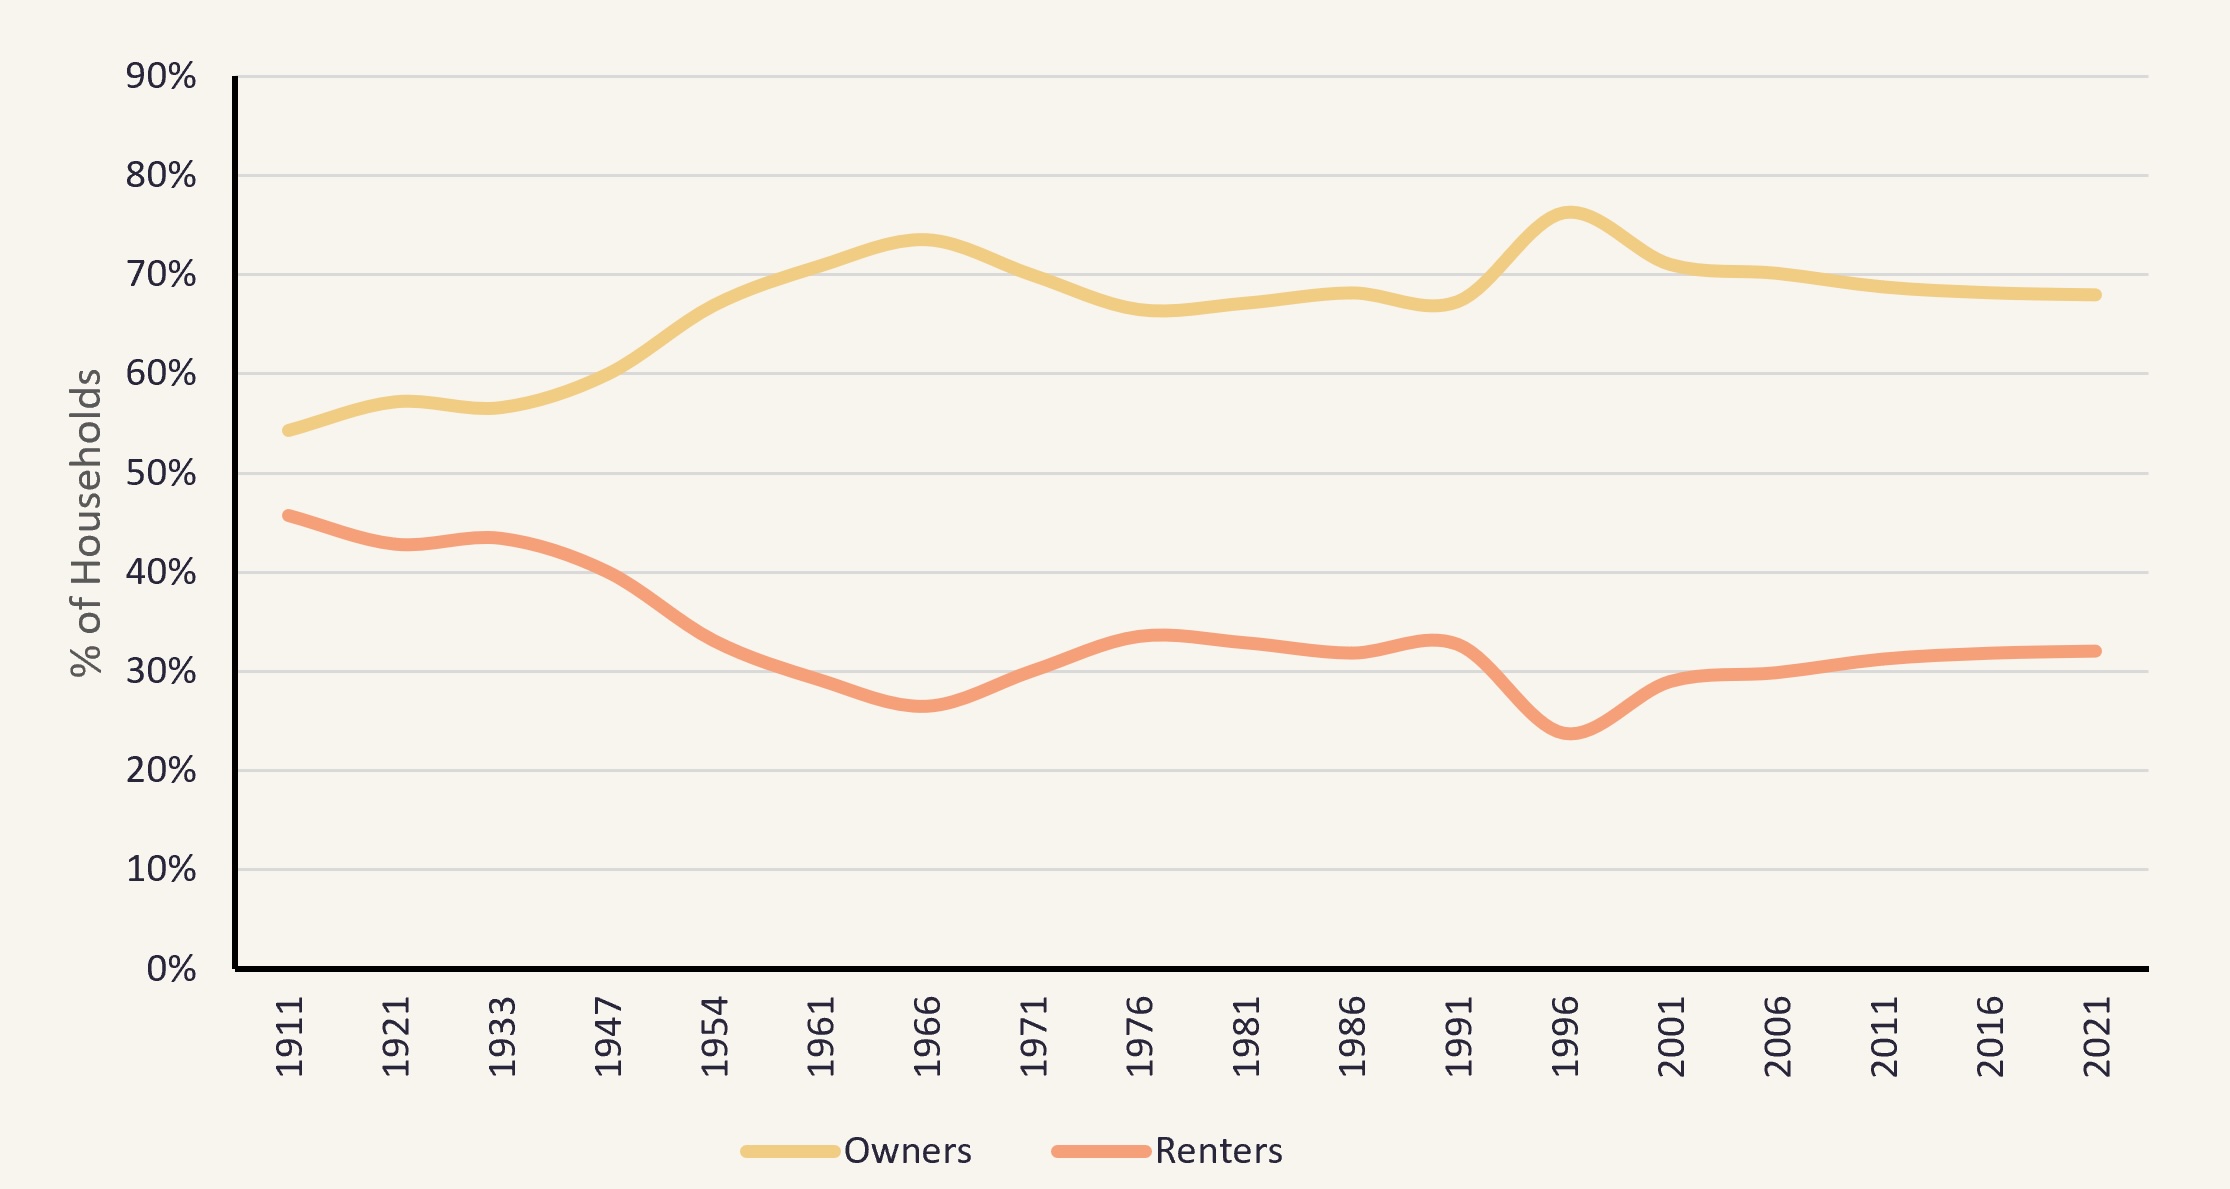
- When you consider the split of owner occupiers to renters across Australia over the past 110 years, you’d be forgiven to think not a whole lot has changed.
- In 1911, renters accounted for around 46% of Australian households. In 2021, it was estimated that renters accounted for 34% of the country’s households.
- In particular, the proportion of renter households has remained largely unchanged in the past 30-years at around 33%.
- This however hides the role of population growth. There were an estimated 2.84 million renter households in the country in 2021 – almost 1 million more than recorded 30-years earlier in 1991.
- This seismic increase in the number of us renting is directly influencing how much we are prepared to pay for rent.
Figure 1: Proportion of Owner Occupiers and Renters (1911-2021), Australia
Source: ABS (2021,2016,2011,2006,2001,1996,1981,1976,1971,1966,1961,1954,1947,1933, 1921, 1911)
Rents Have Decoupled From Wages
Rents, like house prices, have comprehensively decoupled from wages.
- The absolute growth in the number of renter households across the country, which is largely focused in supply-constrained metropolitan areas, has resulted in a stark shift in the rent-wage relationship.
- This decoupling can be directly observed in rental data tracked by property advertising powerhouse REA Group:
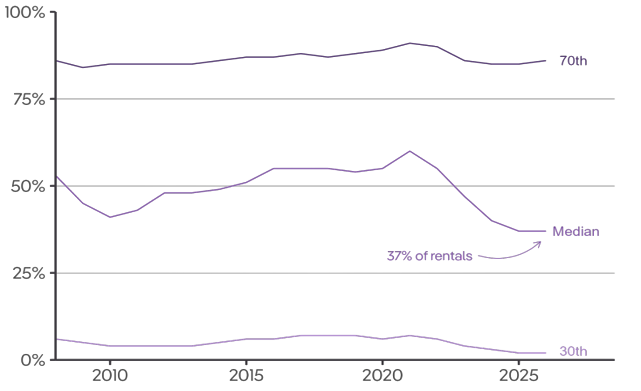
- In 2008, Australian households on a median income could reasonably afford just over 50% of properties advertised for rent.
- By 2026, only around 37% of rental properties advertised would be reasonably affordable to the typical Australian household. This is the lowest level on record.
- In a trend mirrored in the owner occupier market, NSW bears the brunt of the rental affordability crisis. As of 2026, only 26% of advertised rentals would be affordable to the typical household. This contrasts with Victoria – where 63% of advertised rentals are affordable.
Figure 2: Proportion of Advertised Rental Properties which are Affordable (2008-2026), Australia
Source: REA (2026)
A post-COVID phenomenon
Massive increases in rents post-2020 were driven by a surge in migration AND a fall in rental supply.
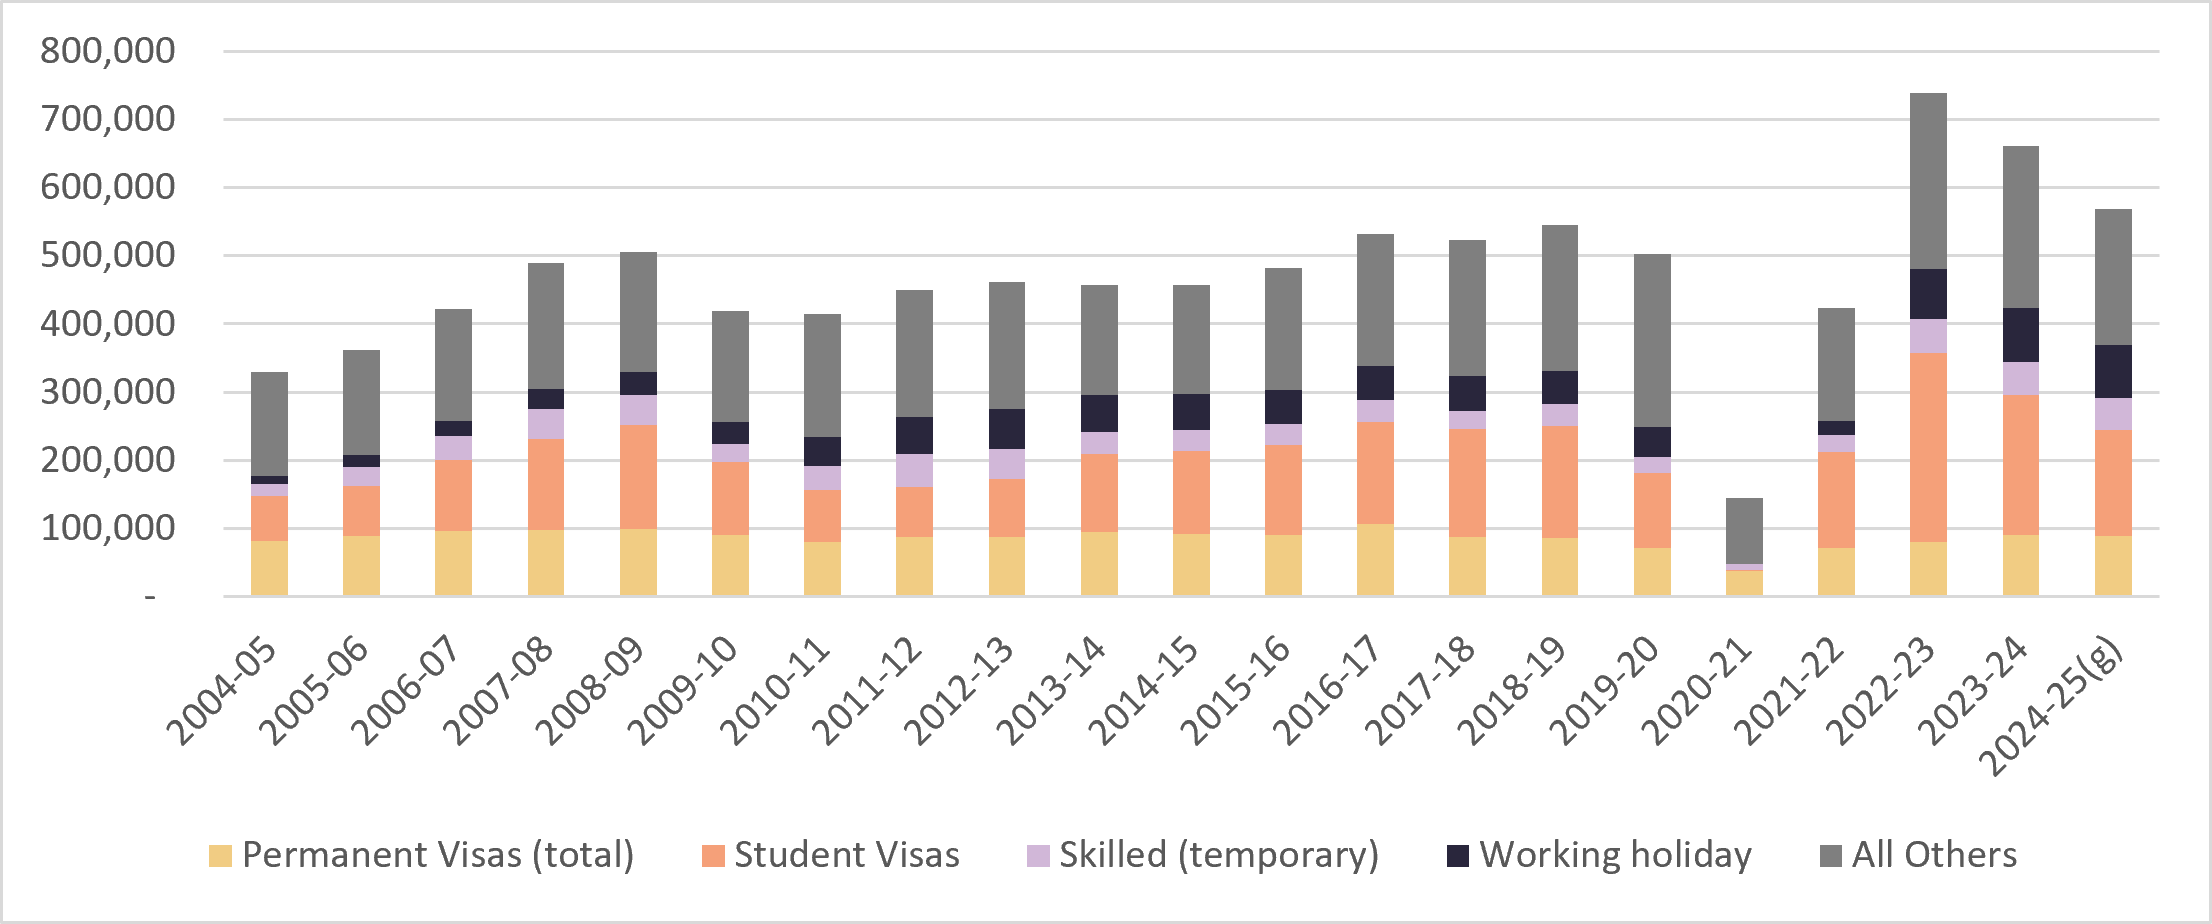
- The surge in post-pandemic migration into Australia is well known. Between 2022 and 2024, Australia recorded a net increase in migration of 967,000 people (the highest on record). Figure 3 shows the surge in overseas migration over 2022-2024.
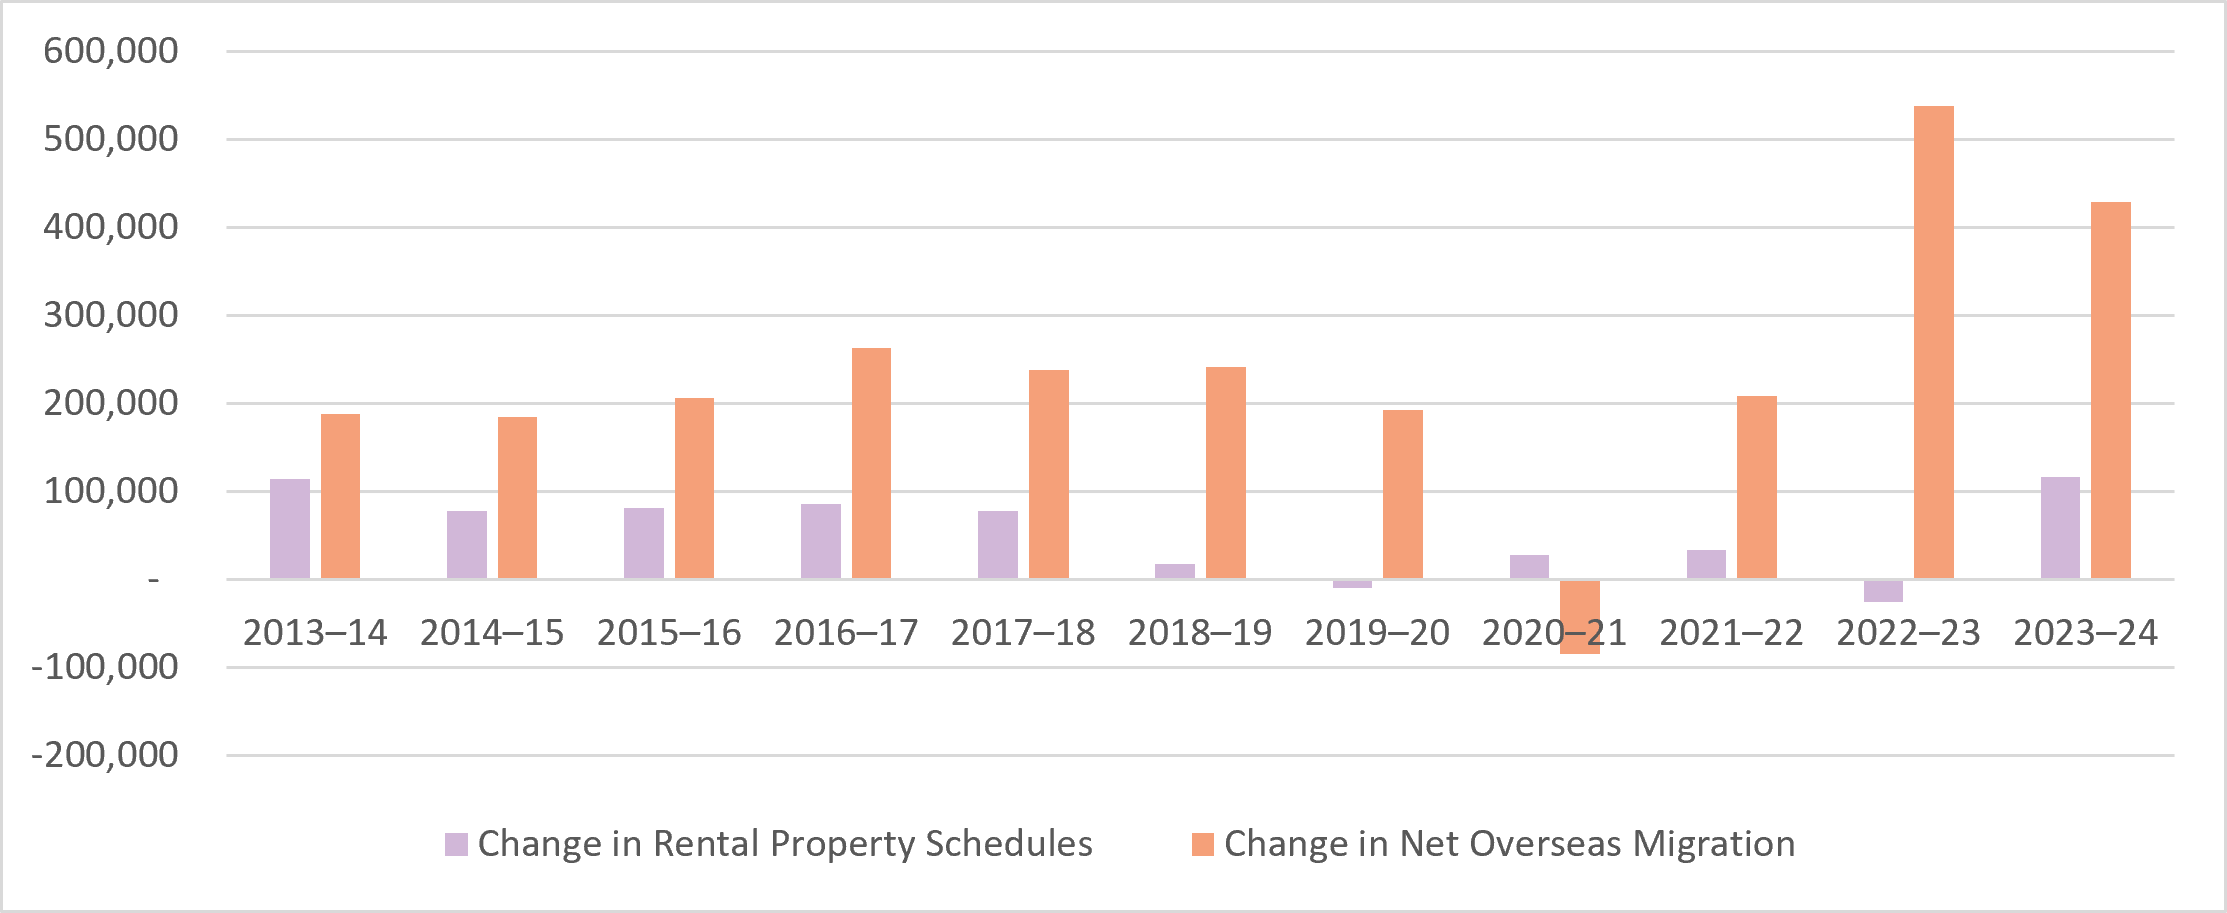
- What isn’t as well known is the sharp drop in rental supply which also occurred over this period. Figure 4 shows the rental property schedules submitted to the ATO in individual tax returns.
- From 2018 onwards, individual tax returns show a decline in rental property schedules, which suggest falling supply of rental stock.
- By the time the international borders opened and there was a surge in international migration, there was even more demand pressure on rental stock which had already been falling in the four years prior.
Figure 3: Migration by Visa Type (2004-2025), Australia
Source: ABS (2026)
Figure 4: Change in Rental Property Schedules* and Net Overseas Migration (2013-2023), Australia
Note: 2024-25 (g) Estimates for 2024-25 are preliminary and will be subject to future revisions.
Source: ABS (2026)
So what happened?
- During the COVID years, interest rates fell and money was cheap. A higher borrowing capacity drove a surge in house prices. Investors cashed in on surging house prices and exited the market while owner occupiers took advantage of low interest rates. Figure 5 shows this phenomenon.
- In all three Eastern States, the availability of rental supply fell dramatically compared to previous years and rents surged.
- The perfect storm of demand (from migration levels and owner occupiers responding to low interest rates) and supply-side factors (withdrawal of investor stock) drove rents across much of Australia to historic highs.
Figure 5: Annual Rental Supply and Median Weekly Rents (All Dwellings; 2014-2023), NSW, VIC & QLD

Source: ATO (2025), DCJ (2025), RTA (2025)
Where is the rental Market Heading?
The 2026 Budget has embarked on a partial reform of the Australian tax system, with changes to negative gearing and the capital gains tax (CGT) currently being progressed through the Australian Senate.
There has been much commentary on the likely impact of these changes on rental markets. The truth is, as is the case with anything to do with complex market systems like the housing market, more complicated.
It’s true that changes to negative gearing and CGT are likely to reduce the relative attractiveness of established residential investment properties, with potential short-term implications for investor demand and rental supply in already constrained markets.
However, rental impacts are unlikely to be driven by a simple pass-through of higher investor tax costs. Rather, impacts will depend on whether reduced investor participation is offset by increased owner-occupier purchases and a redirection of investment toward new housing supply.

References
Australian Bureau of Statistics (2026). Overseas Migration. Accessible from: https://www.abs.gov.au/statistics/people/population/overseas-migration/2024-25#visa
Australian Bureau of Statistics (1911-2021). Historical Census Data. Accessible from: https://www.abs.gov.au/census/find-census-data/historical
Australian Taxation Office (2025). Individuals statistics for Taxation statistics 2022–23. Accessible from: https://www.ato.gov.au/about-ato/research-and-statistics/in-detail/taxation-statistics/taxation-statistics-2022-23/statistics/individuals-statistics
Department of Communities and Justice (2025). Rent and sales report. Accessible here: https://dcj.nsw.gov.au/content/dam/dcj/dcj-website/documents/about-us/families-and-communities-statistics/housing-and-rent-sales/rent_tables_september_2025_quarter.xlsx
REA (2026). Rental Affordability Report 2026. Accessible from: https://www.realestate.com.au/insights/realestate-com-au-rental-affordability-report-2026/
Residential Tenancies Authority (2025). Median Rents Quarterly Data. Accessible from: https://www.rta.qld.gov.au/forms-resources/rta-quarterly-data/median-rents-quarterly-data
Related posts
Dive deeper into insights that matter to you.

Atlas Housing Download Series: Part 5 - Beyond Welfare: The Case for Subsidised Housing

Atlas Housing Download Series: Part 6 - From Housing Approvals to Housing Delivery: What Can We Do?

Atlas Economics is now a proud and excited partner of the Goodes O’Loughlin (GO) Foundation!

Atlas Housing Download Series: Part 3 - Regulatory Change in Building Requirements and Cost Implications
Make smarter decisions
Get in touch with the Team to get an understanding of how we transform data into insightful decisions. Learn more about how Atlas Economics can help you make the right decisions and create impact using our expertise.